Single Cell Data Analysis
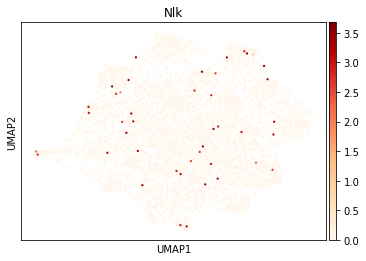
Compare expression of genes from each slide-seq spot. Input a gene of interest to evaluate its expression among sample spots.
GENE : Nlk
Single Cell Data Information
Slide-seq: A scalable technology for measuring genome-wide expression at high spatial resolution.
Science. 2019 Mar 29;363(6434):1463-1467. doi: 10.1126/science.aaw1219. Epub 2019 Mar 28.