Introdduction
 Single cell spatial transcriptomics
is an emerging technology
enabling the quantification of location-aware genomic profiles from biology tissues. It offers the
potential to answer important biological
questions. For example, how the tens of thousands of single cells spatially interact in the brain,
liver or kidney, and how the cells differentiated into
different clusters but cooperates to fulfill certain biological functions.
To accompany to the rapid development of the technology and facilitate interpretation of biological
questions, we present a standalone tool, Spatial
Profiling Viewer (SpaCeV), to visualize and analyze wide-range of single cell spatial transcriptomics
datasets. The software requires plain input data: the cells
Cartesian coordinates and cell types. It offers four categories of functions: (1) spatially laying
out up to 100,000 cells in user’s desktop, and allowing zooming and panning
in real time; (2) visualizing the spatial distribution of cell types based on statistical smoothing
methods so that the fine-structure of tissue can be easily revealed;
(3) analyzing a user specified region of interests (ROI) and quantitatively measuring the
interactions among differential cell types; (4) comparing two ROIs
and statistically comparing the strength of cell interactions.
Single cell spatial transcriptomics
is an emerging technology
enabling the quantification of location-aware genomic profiles from biology tissues. It offers the
potential to answer important biological
questions. For example, how the tens of thousands of single cells spatially interact in the brain,
liver or kidney, and how the cells differentiated into
different clusters but cooperates to fulfill certain biological functions.
To accompany to the rapid development of the technology and facilitate interpretation of biological
questions, we present a standalone tool, Spatial
Profiling Viewer (SpaCeV), to visualize and analyze wide-range of single cell spatial transcriptomics
datasets. The software requires plain input data: the cells
Cartesian coordinates and cell types. It offers four categories of functions: (1) spatially laying
out up to 100,000 cells in user’s desktop, and allowing zooming and panning
in real time; (2) visualizing the spatial distribution of cell types based on statistical smoothing
methods so that the fine-structure of tissue can be easily revealed;
(3) analyzing a user specified region of interests (ROI) and quantitatively measuring the
interactions among differential cell types; (4) comparing two ROIs
and statistically comparing the strength of cell interactions.
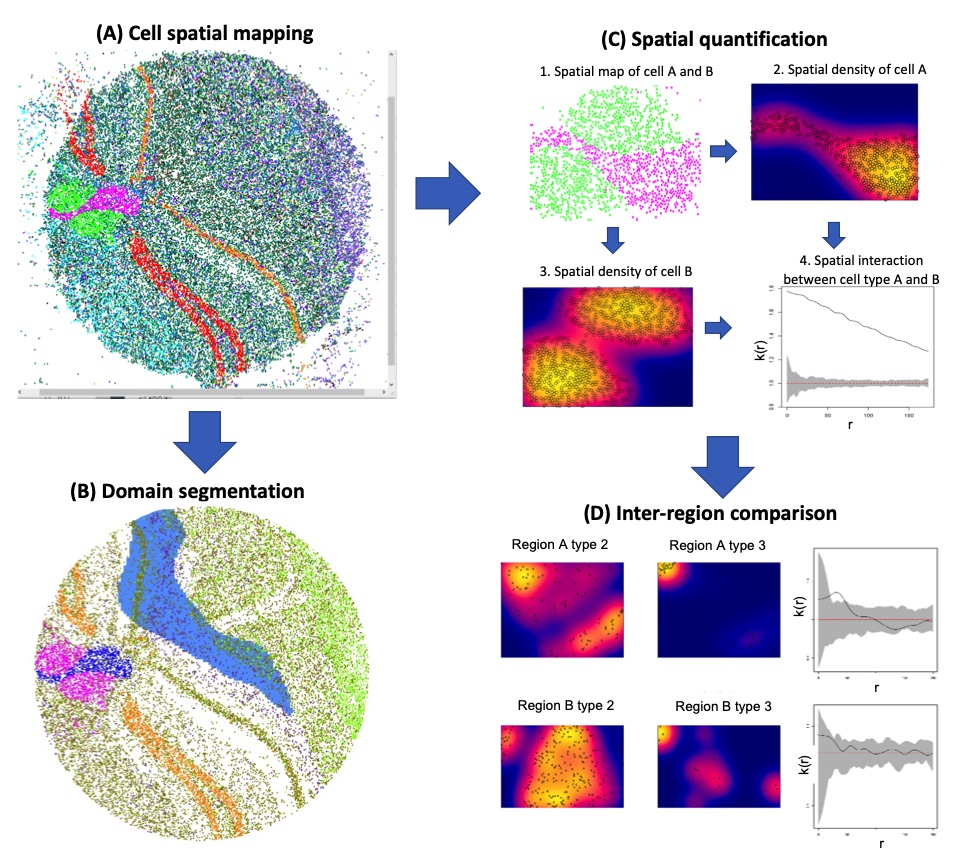
We evaluated SpaCeV using the brain tissue slide-seq datasets. The identified cells types are colored according to user’s preferences (Figure 1a). The fine structured of CA1 tissue in the human hippocampus can be easily visualized by spatial smoothing method (Figure 1b). In one ROI, the habenula and choroid cells are significantly correlated (Figure 1c), and on the other region, these correlation remains with the similar trends. Therefore, researcher can propose the hypothesis that the same strength of habenula and choroid cell interactions remains across the habenula borders.
In summary, SpaCeV offers flexible and interactive analysis routines: from skimming the overall spatial patterns of cells in a coarse-scale to characterizing ROIs with quantitative measurements. It is applicable to a broad range of spatial transcriptomics data for user-friendly visualization and analysis tasks.
exemplar analysis workflow
We prepared the mouse hippocampus data from Slide-seq technology in a tabular form the cell 2-dimensional locations and types. We used the SpaCeV version 1.0.2 to visualize these spatial transcriptomics data. (A) Cell spatial mapping. SpaCeV visualized thirteen thousand data points where the colors represented inferred cell types. Users can use keyboard or mouse to pan or zoom in/out. (B) Domain segmentation. The CA1 region is segmented and visualized in blue shade. This provides better visual identification. (C) Spatial quantification. Based on a user-selected region, two cell types were visualized in a sub figure (C1). SpaCeV calculated the spatial density maps for cell type A and B in Figure (C2) and (C3), respectively. It quantified the strength of cell spatial interactions using the mark correlation function in Figure (C4). As the estimated spatial mark correlation is above the gray 95% confidence band, the interaction between the two cell types are statistically significant. (D) Inter-region comparison. User can select two regions of interests for comparison. Figures in the top (or bottom) are analysis results for the first regions (or the second region): from left to right, the spatial density of cell type A, spatial density of cell type B, and their interaction strength estimated by spatial mark correlation functions.
Download
Download Software for Spatial Profiling Viewer and data for test.
User Guide
Click the box to view the instructions for software SpaCeV.
Contact Us
Address
Danciger Research Building, 5323 Harry Hines Blvd. Ste. H9.124, Dallas, TX 75390Phone Number
214-648-3111