Packages & Pipeline
Spatial Profiling Viewer
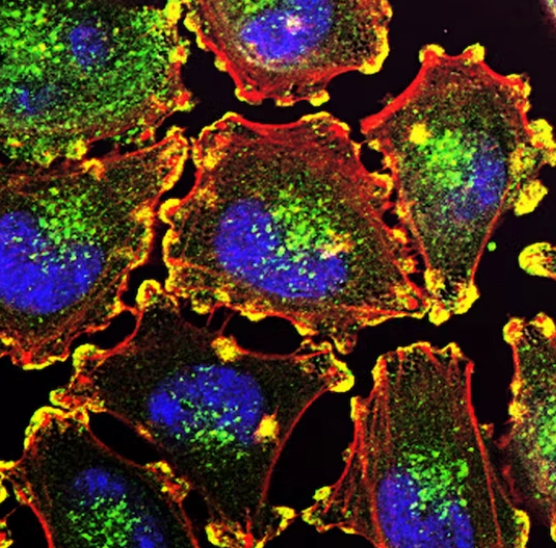
Single cell spatial transcriptomics is an emerging technology enabling the quantification of location-aware genomic profiles from biology tissues. It offers the potential to answer important biological questions. For example, how the tens of thousands of single cells spatially interact in the brain, liver or kidney, and how the cells differentiated into different clusters but cooperates to fulfill certain biological functions. To accompany to the rapid development of the technology and facilitate interpretation of biological questions, we present a standalone tool, Spatial Profiling Viewer (SpaCeV), to visualize and analyze wide-range of single cell spatial transcriptomics datasets. The software requires plain input data: the cells Cartesian coordinates and cell types. It offers four categories of functions: (1) spatially laying out up to 100,000 cells in user’s desktop, and allowing zooming and panning in real time; (2) visualizing the spatial distribution of cell types based on statistical smoothing methods so that the fine-structure of tissue can be easily revealed; (3) analyzing a user specified region of interests (ROI) and quantitatively measuring the interactions among differential cell types; (4) comparing two ROIs and statistically comparing the strength of cell interactions.

SEQMINER2
Seqminer is a highly efficient R-package for retrieving sequence variants from biobank scale datasets of millions of individuals and billions of genetic variants. It supports all variant types, including multi-allelic variants and imputation dosages. It takes VCF/BCF/BGEN/PLINK format as input file, indexes, queries them based upon variant-based index and loads them as R data types such as list or matrix.

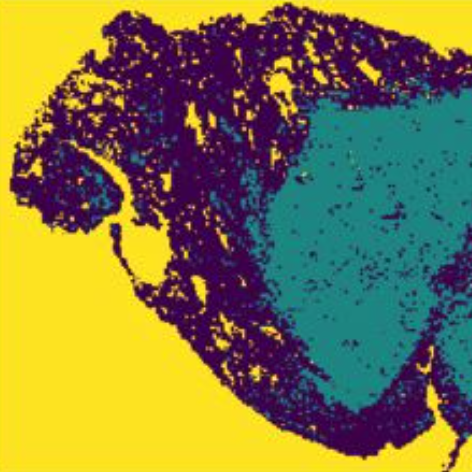
Sprod: De-noising Spatially Resolved Transcriptomics Data Based on Position and Image Information
Spatial Resolved Transcriptomics (SRT) techniques provide gene expression close to or even superior to single cell resolution, while retaining the physical locations of sequencing and sometimes also provide matched pathological images. However, the expression data captured by SRT techniques suffer from severe inaccuracies, including but not limited to drop-outs as in regular single cell RNA-sequencing (scRNA-seq) data. To reduce the level of noise in the data, we developped the Sprod tool, which incorporated image information and spot/bead positional information and used latent graph modeling to impute the gene expression data of each spot/bead.

pMTnet
Deep learning neural network prediction tcr binding specificity to peptide and HLA based on peptide sequences. Please refer to our paper for more details: "Deep learning-based prediction of T cell receptor-antigen binding specificity."(https://www.nature.com/articles/s42256-021-00383-2) Lu, T., Zhang, Z., Zhu, J. et al. 2021.

DIGREsyn
The Drug-Induced Genomic Residual Effect (DIGRE) algorithm is developed to predict compound pair synergistic effect. The algorithm ranked first in the NCI DREAM challenge competition of predicting 91 compound pairs from the most synergistic to the most antagonistic.

IntegrativeBayes
Microbiome omics approaches can reveal intriguing relationships between the human microbiome and certain disease states. Along with identification of specific bacteria taxa associated with diseases, recent scientific advancements provide mounting evidence that metabolism, genetics, and environmental factors can all modulate these microbial effects. However, the current methods for integrating microbiome data and other covariates are severely lacking. Hence, we present an integrative Bayesian zero-inflated negative binomial regression model that can both distinguish differentially abundant taxa with distinct phenotypes and quantify covariate-taxa effects. Our model demonstrates good performance using simulated data. Furthermore, we successfully integrated microbiome taxonomies and metabolomics in two real microbiome datasets to provide biologically interpretable findings. In all, we proposed a novel integrative Bayesian regression model that features bacterial differential abundance analysis and microbiome-covariate effects quantifications, which makes it suitable for general microbiome studies.

HARMONIES
A Hybrid Approach for Microbiome Networks Inference via Exploiting Sparsity
ProbeMapper-R
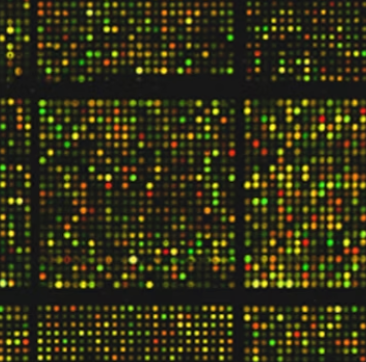
Access to gene expression data has become increasingly common in recent years; however, analysis has become more difficult as it is often desirable to integrate data from different platforms. Probe mapping across microarray platforms is the first and most crucial step for data integration. In this article, we systematically review and compare different approaches to map probes across seven platforms from different vendors: U95A, U133A and U133 Plus 2.0 from Affymetrix, Inc.; HT-12 v1, HT-12v2 and HT-12v3 from Illumina, Inc.; and 4112A from Agilent, Inc. We use a unique data set, which contains 56 lung cancer cell line samples—each of which has been measured by two different microarray platforms—to evaluate the consistency of expression measurement across platforms using different approaches. Based on the evaluation from the empirical data set, the BLAST alignment of the probe sequences to a recent revision of the Transcriptome generated better results than using annotations provided by Vendors or from Bioconductor's Annotate package. However, a combination of all three methods (deemed the ‘Consensus Annotation’) yielded the most consistent expression measurement across platforms. To facilitate data integration across microarray platforms for the research community, we develop a user-friendly web-based tool, an API and an R package to map data across different microarray platforms from Affymetrix, Illumina and Agilent.

Ensemble Network Aggregation (ENA)
Ensemble network aggregation is an approach which leverages the inverse-rank-product (IRP) method to combine networks. This package provides the capabilities to use IRP to bootstrap a dataset using a single method, to aggregate the networks produced by multiple methods, or to aggregate the networks produced on different datasets.

Microbiome Simulation via Generative Adversarial Network
MB-GAN is a deep learning simulation framework for simulating realistic microbiome data. Manuscript is avaialble at bioRxiv https://doi.org/10.1101/863977

MetaPrism: A Toolkit for Joint Analysis of Meta-genomic Sequencing Data
MetaPrism provides joint profile (infer both taxonomical and functional profile) for shotgun metagenomic sequencing data. It also offer tools to 1) classify sequence reads and estimate the abundances for taxa-specific genes; 2) tabularize and visualize taxa-specific gene abundances; 3) build association and prediction models for comparative analysis.

Bayesian Segmentation ModelIng for Longitudinal Epidemiological Studies
The following script is used to apply the Bayesian hierarchical model to detect multiple change points based on the daily active infectious cases of COVID-19, while estimating the basic reproductive number R_0 between all pairs of adjacent change points.
Comprehensive analysis of lung cancer pathology images
Scripts for https://www.nature.com/articles/s41598-018-27707-4, Comprehensive analysis of lung cancer pathology images to discover tumor shape and boundary features that predict survival outcome.
Link: https://github.com/QBRC/pathology-images-analysis-using-CNN

Functional Data Consistency Explorer (FDCE)
Many high-throughput screening studies have been carried out in cancer cell lines to identify therapeutic agents and targets. Existing consistency assessment studies only examined two datasets at a time, with conclusions based on a subset of carefully selected features rather than considering global consistency of all the data. However, poor concordance can still be observed for a large part of the data even when selected features are highly consistent. We assembled nine compound screening datasets and three functional genomics datasets, and derived direct measures of consistency as well as indirect measures of consistency based on association between functional data and copy number-adjusted gene expression data. These results have been integrated into a web application – the Functional Data Consistency Explorer (FDCE), to allow users to make queries and generate interactive visualizations so that functional data consistency can be assessed for individual features of interest.

Tessa
Tessa is a Bayesian model to integrate T cell receptor (TCR) sequence profiling with transcriptomes of T cells. Enabled by the recently developed single cell sequencing techniques, which provide both TCR sequences and RNA sequences of each T cell concurrently, Tessa maps the functional landscape of the TCR repertoire, and generates insights into understanding human immune response to diseases. As the first part of tessa, BriseisEncoder is employed prior to the Bayesian algorithm to capture the TCR sequence features and create numerical embeddings. We showed that the reconstructed Atchley Factor matrices and CDR3 sequences, generated through the numerical embeddings, are highly similar to their original counterparts. The CDR3 peptide sequences are constructed via a RandomForest model applied on the reconstructed Atchley Factor matrices.
The QBRC somatic mutation calling pipeline
The QBRC mutation calling pipeline is a flexible and comprehensive pipeline for mutation calling that has glued together a lot of commonly used software and data processing steps for mutation calling. The mutation calling software include: sambamba, speedseq, varscan, shimmer, strelka, manta, lofreq_tar. It identifies somatic and germline variants from whole exome sequencing (WXS), RNA sequencing and deep sequencing data. It can be used for human, PDX, and mouse data (fastq files or bam files as input). Please refer to the lab website of Dr. Tao Wang, https://qbrc.swmed.edu/labs/wanglab/index.php, for more information.
Cytomulate: Accurate and Efficient Simulation of CyTOF data
Cytomulate is a package to simulation realistic data for Mass Cytometry or Cytometry by Time-of-Flight (CyTOF). We support both model-based through Creation Mode and real-data-based simulation through Emulation Mode. Cytomulate serves as solutions to benchmarking, method validation, prototyping, and more. You can easily generate realistic and accurately CyTOF simulations within seconds.