Online Tools
Lung Adenocarcinoma
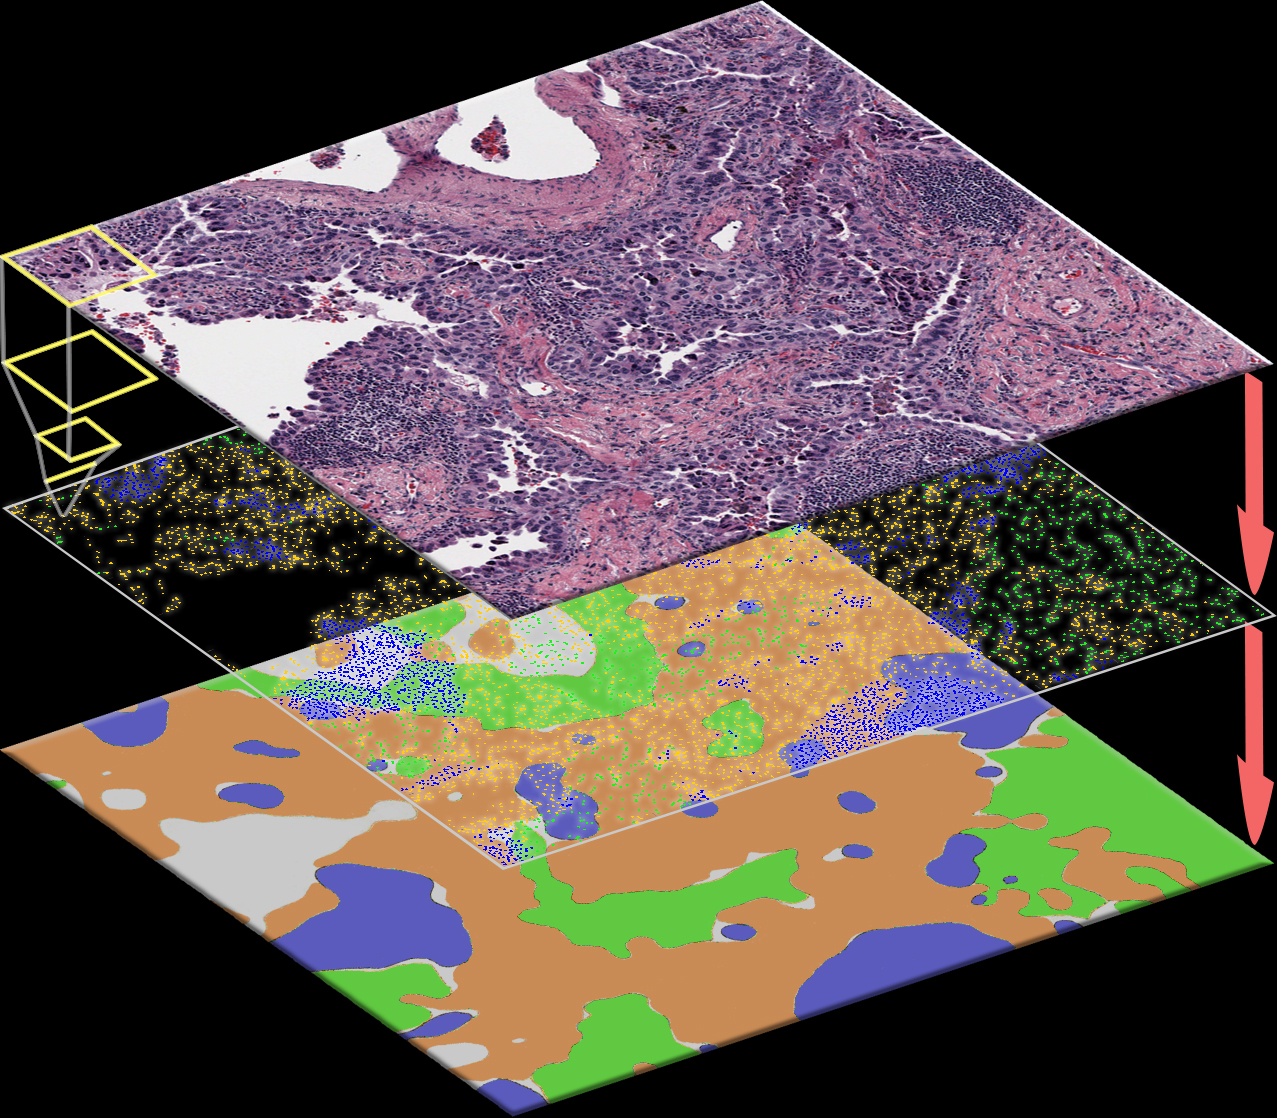
The spatial distributions of different types of cells could reveal a cancer cell growth pattern, its relationships with the tumor microenvironment and the immune response of the body, all of which represent key hallmarks of cancer. However, manually recognizing and localizing all the cells in pathology slides are almost impossible. In this study, we developed an automated cell type classification pipeline, ConvPath, which includes nuclei segmentation, convolutional neural network-based tumor, stromal and lymphocytes classification, and extraction of tumor microenvironment related features for lung cancer pathology images.

VAMPr
To facilitate understanding of the connections between DNA variation and phenotypic AMR, we developed VAMPr (variant mapping and prediction of antibiotic resistance). It utilized 3,393 sequenced bacterial isolates from 9 species along with AMR phenotypes for 29 antibiotics following the Clinical & Laboratory Standards Institute (CLSI) guidelines. It also detected 14,615 variant genotypes and provided 93 association and prediction models.
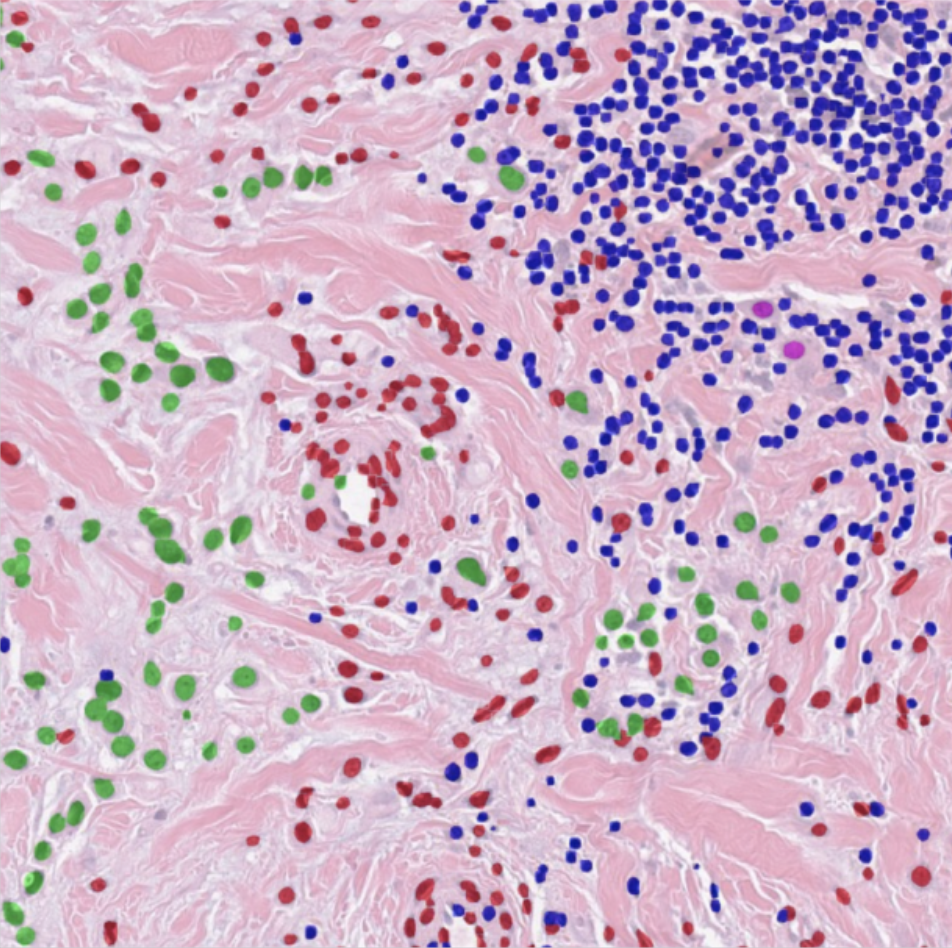
MaskRCNN
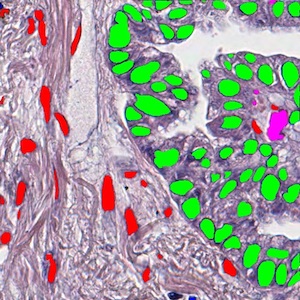
Mask Regional Convolutional Neural Network (Mask-RCNN) is a newly developed deep-learning algorithm. We trained a Mask-RCNN model to segment tumor nuclei, stroma nuclei, lymphocyte nuclei, macrophage nuclei, karyorrhexis, and red blood cells in pathological Hematoxylin & Eosin (HE) stained images. Around 10,000 cells are covered in our training dataset from the National Lung Screening Trial (NLST) cohort. This tool aims to dissect tumor microenvironment in cell level.
Scina
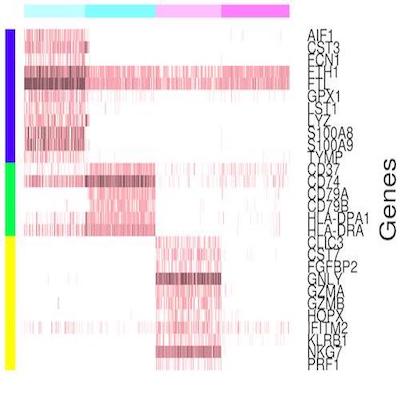
Single cell profiling techniques such as single cell sequencing and cytometry are powerful for comprehensive and high-resolution characterization of the cellular heterogeneities observed in tumors, brain, and other tissues. The identification and assignment of cell types from the pool of profiled cells is the first step of data analysis involving scRNA-seq or cytometry data. To achieve this goal, we developed the SCINA algorithm, short for Semi-supervised category identification and assignment. SCINA is originally designed to assign cell types based on single cell RNA-seq data.
DisHet
To estimate the gene expression levels and component proportions of the normal, stroma (immune) and tumor components of bulk tumor RNA-Seq samples. Although DisHet is designed for dissection of bulk tumor samples using matched normal tissue and tumorgraft RNA-seq data, it is widely applicable to dissection of gene expression of any mixture of 3 types of cells.
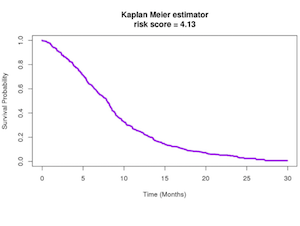
Prognostic Model for Non Small Cell Lung Cancer
Prognostic Model for Predicting Survival in Non Small Cell Lung Cancer Patients.
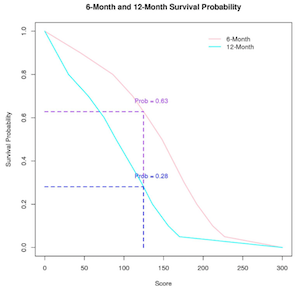
Prognostic Model for Small Cell Lung Cancer
Prognostic Model for Predicting Survival in Small Cell Lung Cancer Patients.
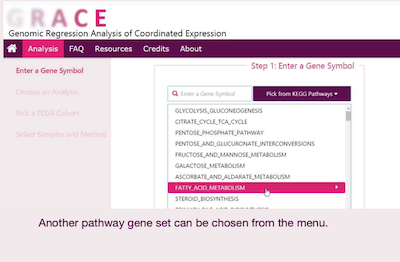
GRACE
Genomic Regression Analysis of Coordinated Expression (GRACE) is a method developed to remove effect of copy number alteration from co-expression analysis so that the resulting genes are mostly based on biological regulation. This database allows users to perform co-expression analysis with tumor or normal samples from various cancer types based on TCGA studies.

Lung Cancer Explorer
The Lung Cancer Explorer is an online tool for exploring and analyzing gene expression data from dozens of accessible public lung cancer datasets.
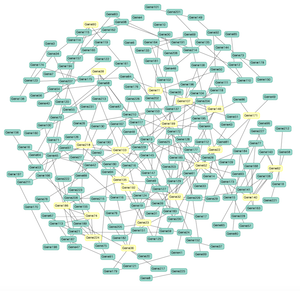
Geneck
GeNeCK (Gene Network Construction Kit) is a comprehensive online tool kit that integrate various statistical methods to construct gene networks based on gene expression data and optional hub gene information.
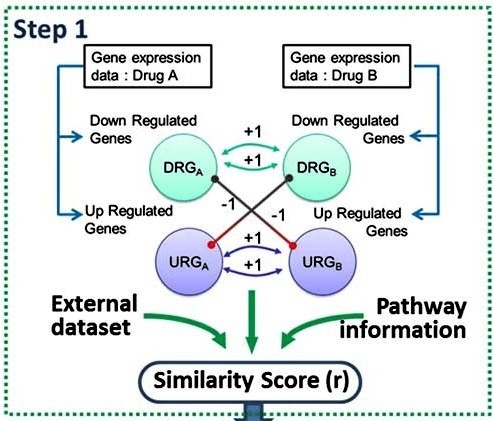
Drug Combination
We developed a novel Drug-Induced Genomic Residual Effect (DIGRE) computational model to predict drug combination effects by explicitly modeling the drug response dynamics and gene expression changes after individual drug treatments. The DIGRE model won Best Performance in the National Cancer Institute’s DREAM 7 Drug Combination Synergy Prediction Challenge, an international crowdsourcing-based computational challenge for predicting drug combination effects using transcriptome data.
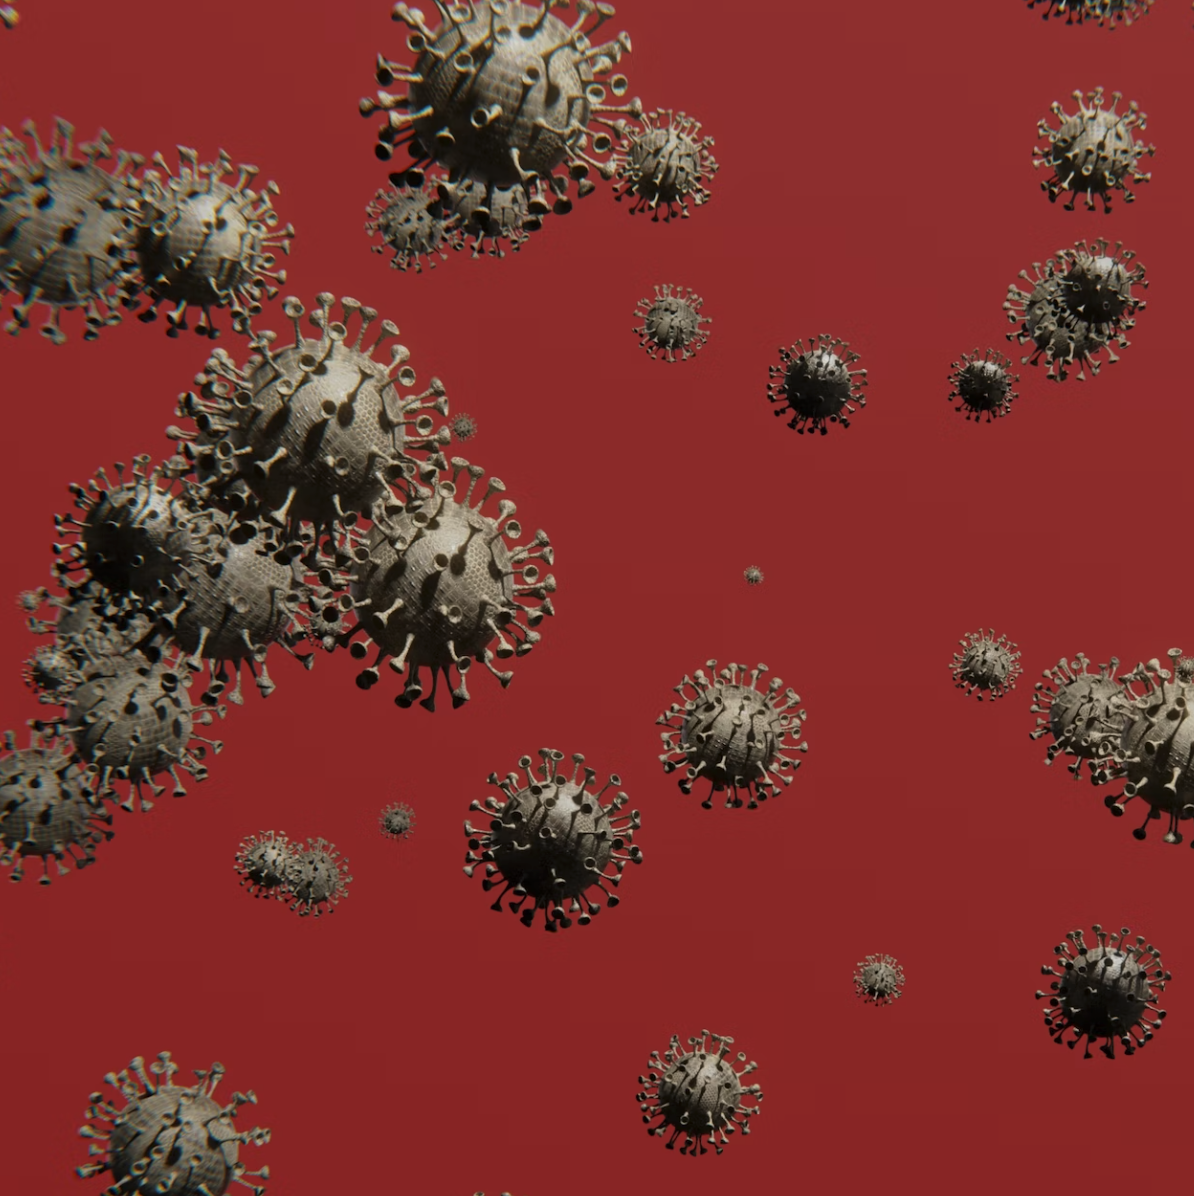
PARP
PARP stands for Pan Antibiotic Resistance Prediction. It is a deep learning model to predict microbial resistance of 35 antibiotiocs based on bacterial genomes.

SAFARI
SAFARI (Shape Analysis For AI-Segmented Images) provides functionality for image processing and shape analysis. In the context of reconstructed medical images generated by deep learning-based methods and produced from different modalities such as X-ray, Computational Tomography (CT), Magnetic Resonance Imaging (MRI), and pathology imaging, SAFARI offers tools to segment regions of interest and extract quantitative shape descriptors for applications in signal processing, statistical analysis and modeling, and machine learning.

MiCoDe
Microbiomes harbor intricate associative connections, or co-occurrence, between member taxa that may be critical to the assembly and function of the microbial community. Identifying and characterizing these associations from metagenomic data may offer informative insight into disease progression and prevention. The organization of the microbiome is thought to be a singular assortative network, where interactions between taxa can readily be clustered into segregated and distinct communities. However, identifying distinct communities from microbiome data remains challenging. Microbiome community detector (MiCoDe) is a web tool that fits a weighted stochastic block model (WSBM) to a network edge-weight matrix to study the community structure of co-occurrence networks derived from metagenomic data.
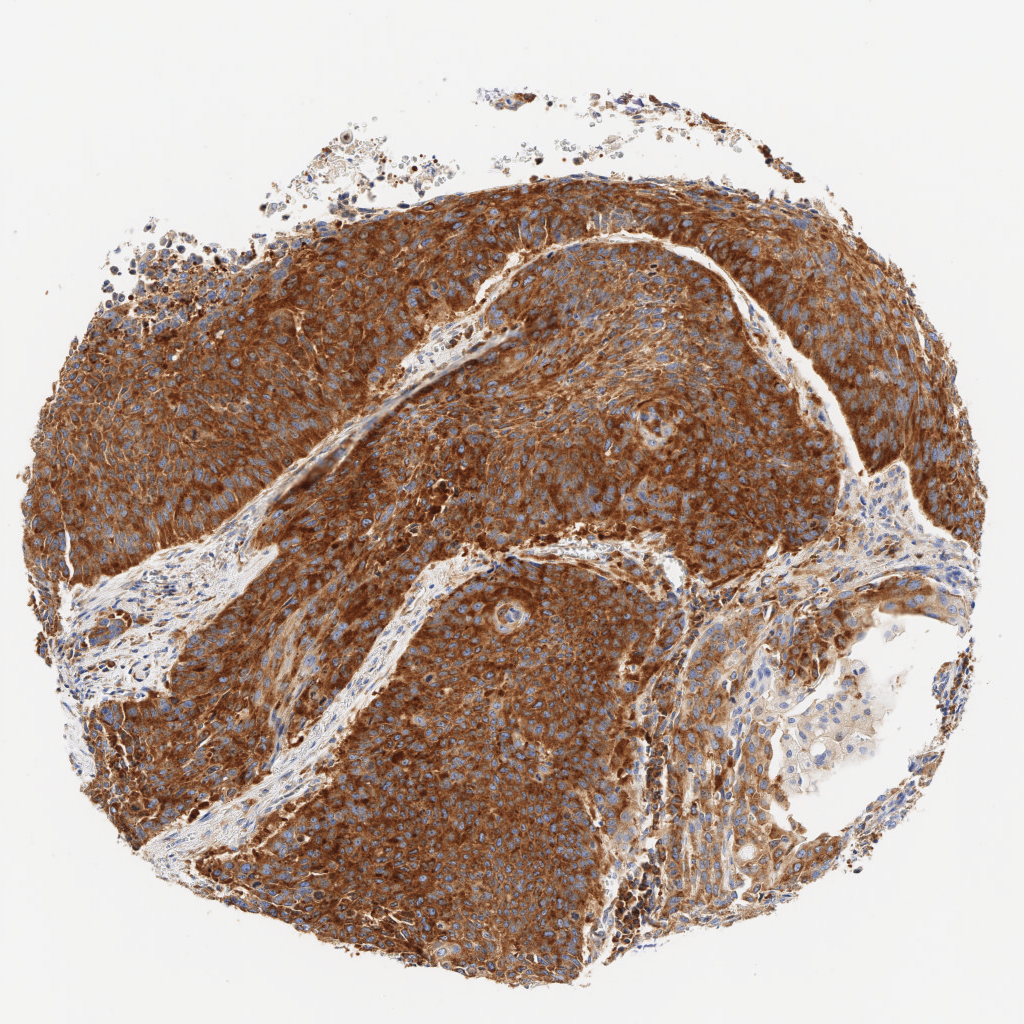
Automatic H-score Quantification (AHSQ)
AHSQ is a deep learning-based computational algorithm to quantify the H-score of immunohistochemistry (IHC) images. It starts with color deconvolution of the original IHC image to separate hematoxylin staining and DAB staining. Based only on hematoxylin staining, our trained UNet-MobileNet model is used for region recognition, and basic image processing methods are used for nuclei segmentation. By combining the mask for the target cell region and the mask for nuclei, the nuclear region and the cytoplasmic region of the target cells are identified respectively, and one of them is regarded as the target area for H-score quantification. The DAB staining of each pixel within the target area is classified as negative staining, weak staining, moderate staining or strong staining according to the predefined thresholds. The final H-score is calculated as a weighted average of the percentages of weak staining (weight = 1), moderate staining (weight = 2) and strong staining (weight = 3) within the target area. In sum, this algorithm can take an IHC image as input and directly output the H-score within a few seconds, which drastically speeds up the whole IHC image analysis procedure.

HARMONIES
Microbiota forms complex community structures and collectively affect human health. Understanding the structural organization of the human microbiome plays a vital role in revealing how the microbial taxa are collaborating or competing with each other under different host physiology conditions. The exponentially growing large datasets made available by next-generation sequencing technology motivate the development of statistic tools to quantitatively study the microbial community structures. To this end, we proposed a general framework, HARMONIES, a Hybrid Approach foR MicrobiOme Network Inferences via Exploiting Sparsity, to infer the microbial association networks.
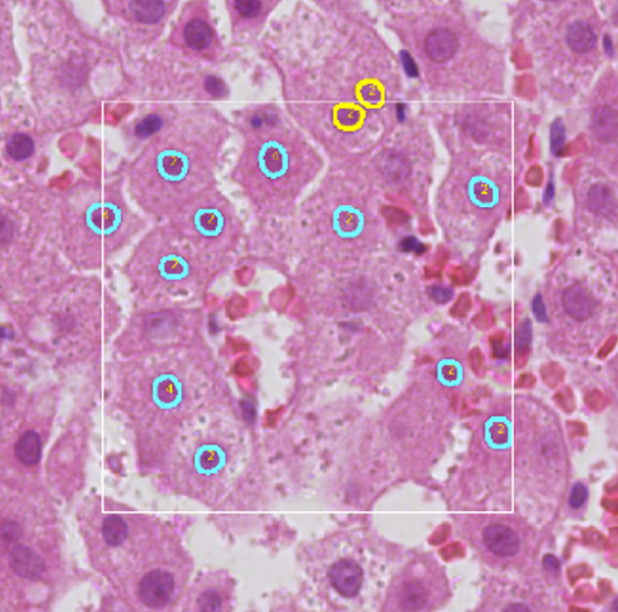
ICPQ
ICPQ (IMAGE-BASED CELL PLOIDY QUANTIFICATION) is a deep learning-based computational algorithm to characterize and quantify hepatic ploidy for individual patients. To make the whole analysis procedure more accessible for clinical samples, the algorithm can quantify ploidy information using hematoxylin-eosin (H&E) histopathology images. A deep learning model was trained to segment and classify different types of nuclei on H&E histopathology images. Based on the identified hepatocyte nuclei, both cellular and nuclear ploidy are calculated. Using this algorithm, we can establish the total number of hepatocytes and detailed ploidy of each hepatocyte in the region of interest (ROI).

RSEQNORM: RNA-SEQ NORMALIZATION
RNA-seq Normalization implements seven normalization methods, among which five are existing methods (DESeq, TMM, RPM, PoissonSeq and UQ) for fresh frozen (FF) RNA-seq data. Two novel normalization methods, MIXnorm and SMIXnorm, can be applied to both FF and formalin-fixed paraffin-embedded (FFPE) RNA-seq data.
HD-staining v2
The HD-Staining-v2 system utilize the latest one-stage detection algorithms YOLO to dramatically enhance the nuclei detection and segmentation speed. The new system is 15 times faster than HD-Staining-v1 with improved accuracy and precision. Whole slide imaging analysis reveals the blazing fast speed of the v2 system that can potentially reduce the workloads from weeks to hours.

BEPITBR
The ability to predict B cell epitopes from antigen sequences is critical for biomedical research and many clinical applications. However, despite substantial efforts over the past 20 years, the performance of even the best B cell epitope prediction software is still modest. Based on the idea of T-B reciprocity, BepiTBR is a B cell epitope prediction model that demonstrates improved performance by incorporating prediction of nearby CD4+ T cell epitopes close to the B cell epitopes.