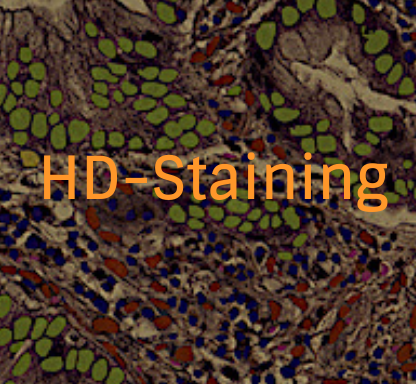
HD-staining
Histology-based Digital Staining of Pathology Images (HD-staining) is a newly developed deep-learning algorithm which aims to dissect tumor microenvironment in cell level.
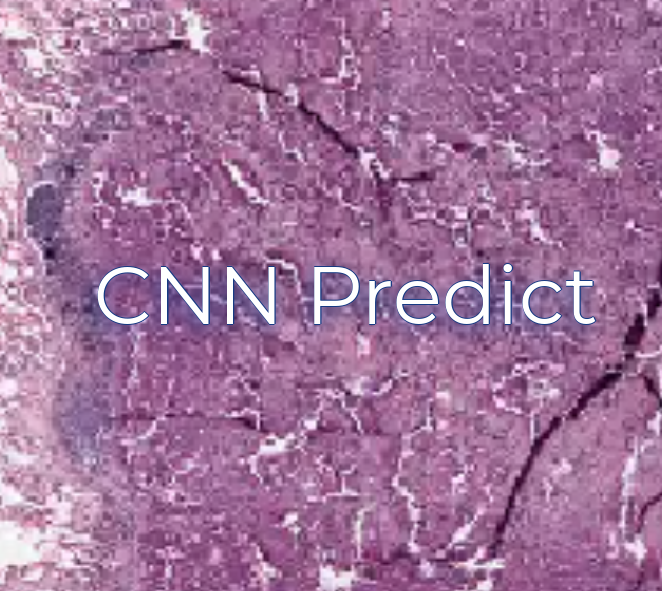
CNN Prediction Tool
Lung cancer is a very prevalent cancer type and pathological imaging assessment is an important tool for diagnosis. Previously, pathological imaging reading is done by human doctors. However human evaluation is objective and labor-intensive. In addition, pathological images may contain important prognosis and treatment response information that cannot be reliably understood by humans. Therefore, it is a very important to create machine learning algorithms to automatically recognize pathological imaging data and correlate the automatically retrieved features with patient phenotype.
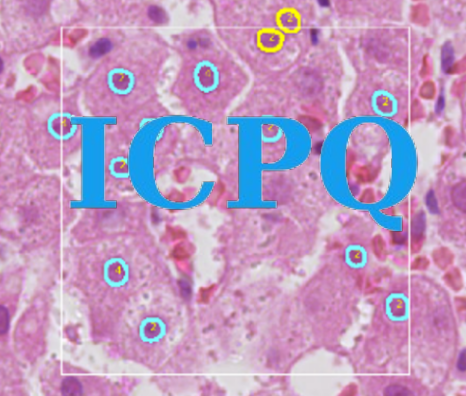
IMAGE-BASED CELL PLOIDY QUANTIFICATION (ICPQ)
ICPQ is a deep learning-based computational algorithm to characterize and quantify hepatic ploidy for individual patients. To make the whole analysis procedure more accessible for clinical samples, the algorithm can quantify ploidy information using hematoxylin-eosin (H&E) histopathology images. A deep learning model was trained to segment and classify different types of nuclei on H&E histopathology images. Based on the identified hepatocyte nuclei, both cellular and nuclear ploidy are calculated. Using this algorithm, we can establish the total number of hepatocytes and detailed ploidy of each hepatocyte in the region of interest (ROI).

Gene Network Construction Tool Kit
GeNeCK (Gene Network Construction Kit) is a comprehensive online tool kit that integrate various statistical methods to construct gene networks based on gene expression data and optional hub gene information.
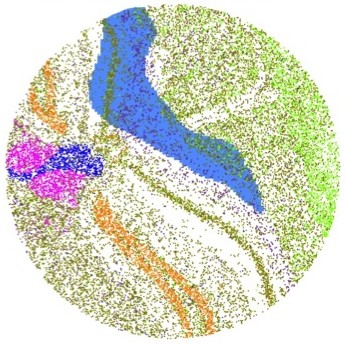
Spatial Profiling Viewer
Single cell spatial transcriptomics is an emerging technology enabling the quantification of location-aware genomic profiles from biology tissues. It offers the potential to answer important biological questions. For example, how the tens of thousands of single cells spatially interact in the brain, liver or kidney, and how the cells differentiated into different clusters but cooperates to fulfill certain biological functions. To accompany to the rapid development of the technology and facilitate interpretation of biological questions, we present a standalone tool, Spatial Profiling Viewer (SpaCeV), to visualize and analyze wide-range of single cell spatial transcriptomics datasets. The software requires plain input data: the cells Cartesian coordinates and cell types. It offers four categories of functions: (1) spatially laying out up to 100,000 cells in user’s desktop, and allowing zooming and panning in real time; (2) visualizing the spatial distribution of cell types based on statistical smoothing methods so that the fine-structure of tissue can be easily revealed; (3) analyzing a user specified region of interests (ROI) and quantitatively measuring the interactions among differential cell types; (4) comparing two ROIs and statistically comparing the strength of cell interactions.